SolarWinds Orion Review: Customizable Integrated IT Monitoring Platform

SolarWinds provides a wide array of IT monitoring and management solutions. The company’s expertise spans across multiple sectors of the IT industry, such as cloud technology, security, network monitoring and database performance analysis. For nearly 20 years, SolarWinds has been a global leader in developing tools to manage hardware and software assets, which are used by customers in a variety of industries.
One of the most popular SolarWinds product lines is the Orion Platform. The Orion suite features six tools, including the Network Performance Manager, Netflow Traffic Analyzer, Network Configuration Manager, Virtualization Manager, Server and Application Monitor, and the Storage Resource Monitor. Together, these products form a fully integrated IT management system that provides complete oversight of network, application, and storage resources.
Software from the Orion Platform can be purchased à la carte style, which gives you the freedom to choose which tools will be most useful for your business. Whether your IT infrastructure consists of 10 nodes or 10,000, SolarWinds offers solutions that can reduce downtime and improve overall business efficiency.
In this review, we'll explore the functionality of the three most popular tools from the Orion Platform: the Network Performance Manager (NPM), the Server and Application Monitor (SAM), and the Storage Resource Monitor (SRM).
Pros
- Dashboards are fully customizable, which enables users to focus only on metrics that they care about.
- Orion Platform tools, as well as other SolarWinds products, are completely modular. Multiple tools can be purchased and integrated seamlessly into the UI, which eliminates the need to use separate pieces of software to monitor your network and system infrastructure.
- Designed to scale well as your IT infrastructure grows.
Cons
- A substantial upfront investment is required to purchase licenses, compared to other SaaS providers which offer month-to-month pricing.
- Each tool in the Orion Platform has a dizzying array of features, which can result in a steep learning curve.
SolarWinds Orion Pricing
- Network Performance Monitoring (SL100): $2,895 for up to 100 elements
- Server and Application Monitor (AL150): $2,995 for up to 100 monitors
- Storage Resource Monitor (SRM25): $2,935 for up to 25 storage disks
Network Performance Monitor (NPM)
In addition to providing real-time performance metrics of network devices, NPM is designed to quickly identify, diagnose, and resolve any network-related issues. The fault management capabilities paint a clear picture of cause-and-effect behaviors, which help to streamline the troubleshooting process.
The backend functionality of NPM is simple in nature. As with most network monitoring software, a polling engine continually requests CPU, network traffic, memory, and other standard statistics from SNMP-enabled devices. NPM also supports ICMP to poll for rudimentary status requests and WMI for additional communications and security information. To monitor a custom device on your network, such as a sensor, you can configure an OID poller to gather the desired data. Using these polling methods to collect instantaneous snapshots of node health, NPM crunches numbers on the backend and presents an organized flow of data via the web console.
One of the major strengths of NPM, and of all Orion products, is the ease of deployment. The Orion Platform software can be installed, configured, and launched within one or two hours. Most environment and database settings are configured automatically during the installation process, saving hours of troubleshooting.
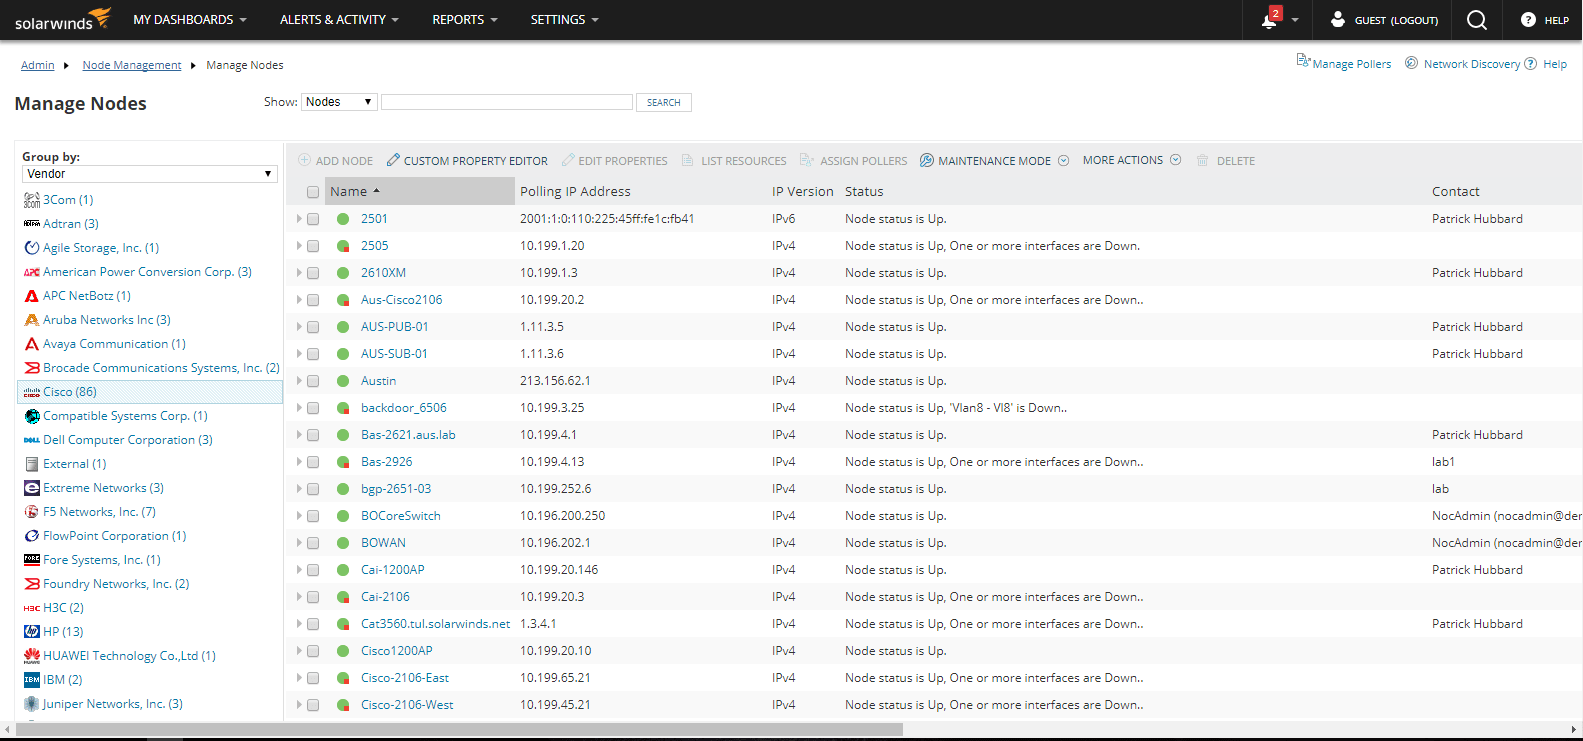
To begin monitoring your network, you must first add your servers, routers, switches, access points and ports as nodes. Assuming SNMP is enabled, adding devices is a painless process. However, if there are many non-standard nodes that require specialized polling configurations, this can be a time-consuming process. For convenience, NPM allows for nodes to be grouped according to region, vendor, or device type.

Once your nodes are properly configured, you can fully customize the information layout of the NPM Summary page. You can add widgets for active alerts, visual representations or maps of architectures, hardware health, event logging, and even wireless signal strength heat maps. With so many options to choose from, customizing the system to suit your needs can require a bit of trial and error, and can be a bit overwhelming for new users.
From the summary page, you can view the status of any node in your network. Detailed reports of current and historical metrics such as latency, NIC availability, utilization, and CPU load are compiled in a single location. This information provides the capability to accurately diagnose issues at the device level. Most data displayed is extremely relevant but some metrics seem almost out of place for a network monitoring tool, such as hardware health statistics.

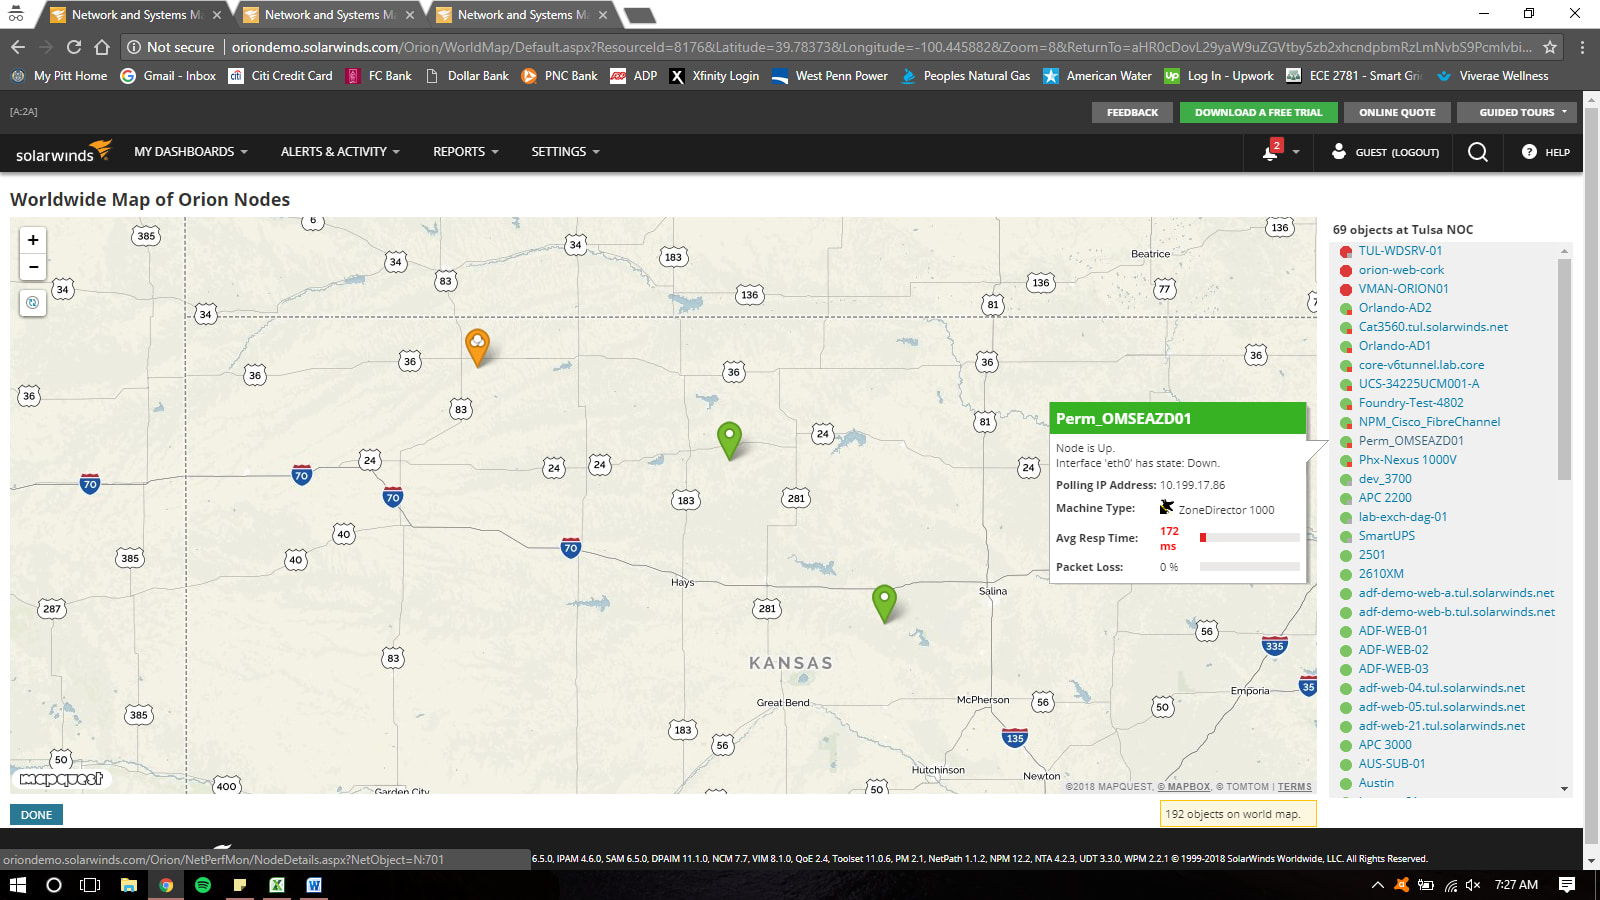
A major selling point for NPM is the resource mapping feature. The Worldwide Map widget shows all nodes pinpointed according to their geographic location. This visualization provides high-level monitoring and a means of quickly determining any locations that are experiencing issues. In the event that a node goes down, the pinpoint will turn yellow or red, indicating device problems. This can be a powerful tool in managing IT assets across various data centers.
You can manage scheduled reports and alert notifications from the Alerts & Activity link. When adding new alerts, you can define alert properties, trigger criteria, actions to perform when active, and reset conditions. These alerts can be assigned to individual objects and nodes or simply across the entire deployment. SMTP and email settings can be configured to generate notifications when an object has triggered an alert. When paired with the worldwide map, this feature gives you effective fault management capabilities.

From the NPM summary page, the Active Alerts widget provides preliminary details about which objects are experiencing issues or outages. To remove a notification from the list, it must first be "acknowledged." A common problem that users experience with this feature is that nodes removed from the alert list still trigger notifications at times. There have also been complaints about occasional false positives being generated.
You can find in-depth information about any issue by clicking on the active alert from the summary page widget. You can then start troubleshooting accordingly, based on the defined problem and system data that NPM collected when triggered.

NPM allows you to take a proactive management approach with your IT infrastructure. Overall, this software is a completely streamlined and user-friendly solution. Despite its minor quirks, it is a worthwhile investment for medium to large-scale businesses.
Server & Application Monitor (SAM)
SAM is another powerful tool in the Orion suite that helps you manage your distributed IT resources. This software is just as vital as NPM to the smooth operation of business-critical systems. SAM provides insight at the application level of the entire environment, and keeps track of metrics such as response time, load on the CPU and I/O operation rates. If a service or app crashes, you can perform root cause analysis easily with SAM, similar to how NPM can be used to diagnose network issues. Running both NPM and SAM ensures total built-in coverage of diagnostic and monitoring capabilities.
SAM gathers and reports performance information from servers or devices that run apps for your business. All types of custom or commercial apps and services can be monitored with SAM. The assigned licenses are based on the number of monitors, which are defined by total device nodes or disk volumes. Depending on the scale of your infrastructure, licenses can quickly become a scarce commodity as monitors are added and upgrading modules may be inevitable, which can result in substantial costs.
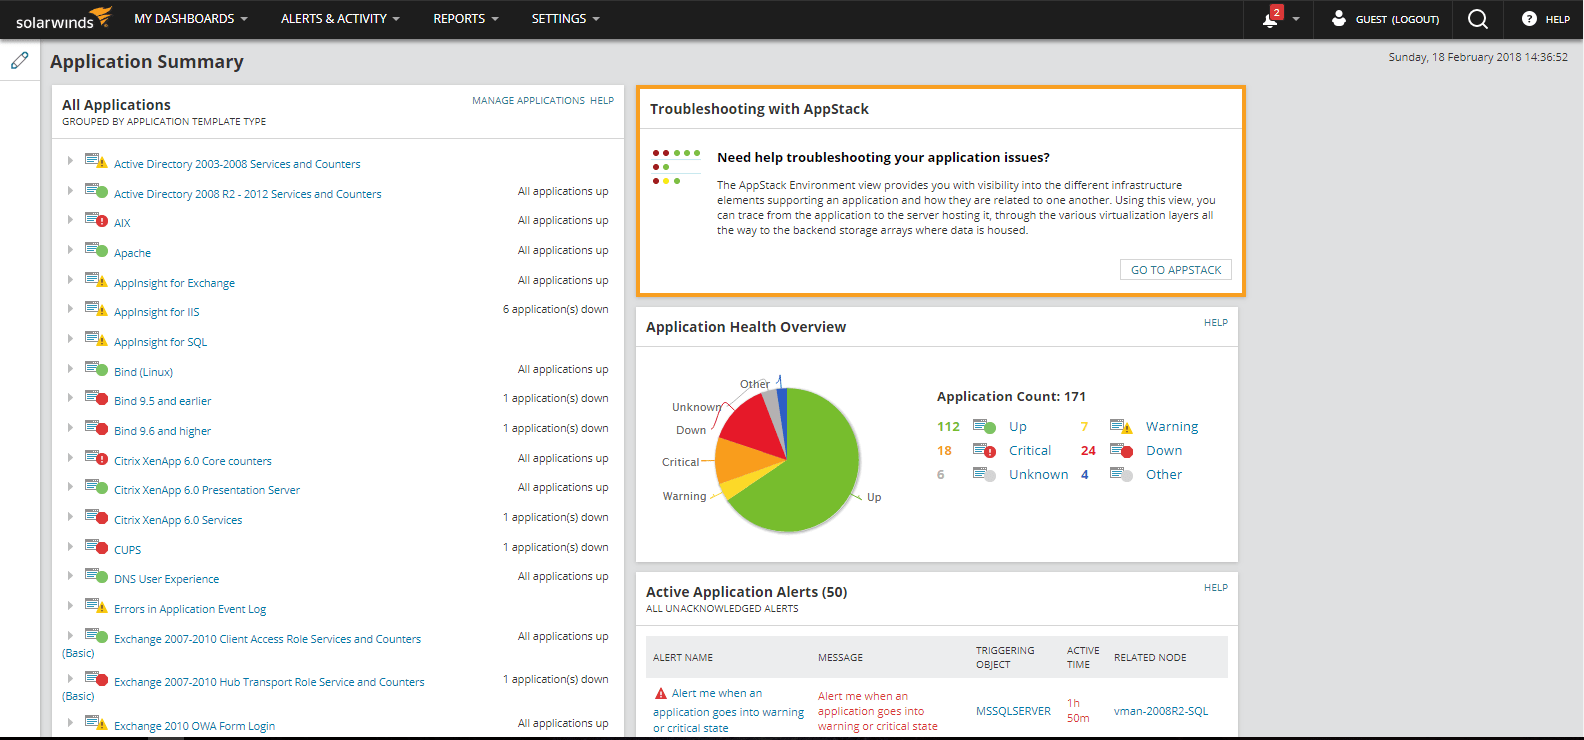
The SAM summary page follows the same layout as NPM with customized widgets displaying real-time status information of applications being monitored. With countless metrics available for the hundreds of apps, services and system processes running for your business, designing an effective layout for the summary page can be daunting.
The SAM database interface enables you to set up application monitors. To monitor applications, such as Apache, IIS, MySQL, and Exchange, you must assign the appropriate template to a node or device. These templates contain the code required to poll and extract data from the desired app. There are currently more than 1,200 monitoring templates built into SAM. A major advantage of SAM over other application monitoring programs is access to open-source templates created from THWACK, the SolarWinds support community. For any commercially available application running on your resources, there will most likely be an associated monitoring template.
When an app crashes or enters a critical state, SAM will identify it immediately. From the summary page, the name of the application monitor will turn red to indicate a problem. When viewing the additional details, SAM will display diagnostic information about the network health of the associated node and application performance metrics, which can help pinpoint the source of any issues. Without SAM and NPM, you would have to manually troubleshoot at both the network and application level in order to isolate the problem.
The alerting functionality in SAM is almost identical to that of NPM. New alerts and notifications will be generated when any monitored application crashes or enters a critical state.

A notable feature of SAM is AppInsight, which is a specialized monitoring tool that provides an in-depth level of detail compared to a standard template. AppInsight is currently available for use with SQL, IIS, and Exchange applications. When AppInsight is deployed on a server running an instance of SQL, SAM is capable of collecting data related to memory and cache usage, error logs, active users according to database, disk operation times, and query execution times. These non-standard performance metrics provide great insight for database optimization or troubleshooting.

If you have several services or applications running across various platforms in your IT network, SAM is a must-have tool. When paired with NPM, SAM helps reduce the need to babysit systems to ensure smooth operation, and helps prevent you from wasting time troubleshooting via process of elimination.
Storage Resource Monitor (SRM)
If your business utilizes big data, expensive storage subsystems and data processing equipment are most likely integrated into your IT infrastructure. SRM provides insight into the performance of storage pools, which ultimately helps increase availability. More than 17 vendors of SAN and NAS arrays, such as Dell, IBM, HP, and Hitachi, are supported within SRM.
When configuring the Storage Summary main page, you'll find that there are fewer widgets available compared to NPM or SAM.

SRM allows you to drill down into each monitored array to observe performance benchmarks such as IOPS, storage capacity, latency, and throughput. Real-time and historical data are presented with charts and line graphs to provide indications of system health.

An interesting feature included with SRM is the ability to estimate when a storage pool will utilize all of its subscribed capacity. Historical usage data is analyzed to produce a conservative projection. When any of your storage resources reaches a predefined capacity percentage or when a projected timeline drops below an interval, SRM generates a notification.

Deploying SRM allows you to passively manage the health of your storage resources and forecast accordingly if your business were to expand. Instead of manually verifying that your arrays have proper storage allocation and ample capacity, SRM helps users perform all of these monitoring tasks automatically.
The Verdict: Is SolarWinds Orion Right For You?
The SolarWinds Orion Platform allows a single system admin to do the job of dozens. Although you'll be able to set up the Orion suite of products in just a few hours, it can take months to master all of the features and customize the interface to suit your exact needs.
However, SolarWinds Orion is a worthwhile investment for businesses that need help monitoring their IT infrastructure. With all of the tools included in the Orion Platform, you'll be able to identify and resolve issues from a single interface before they grow into business-crippling network outages or device failures. Hardware and software resources in any type of hybrid IT environment can be optimized for maximum efficiency, thereby improving performance and eliminating downtime.