Datadog Review: Popular Infrastructure Monitoring Service

Datadog is a Software as a Service (SaaS) infrastructure & application monitoring tool that helps companies detect and resolve issues swiftly -- ideally before they impact end users. The product integrates with over 200 popular tools and services, which makes it easy to monitor every component of your tech stack. Datadog is best-known as a popular infrastructure monitoring tool, but the company has recently launched an integrated application performance monitoring product.
Though Datadog is a newer company, it has gained wide adoption amongst startups, as well as enterprise technology companies, due to its ease of use. Getting started with Datadog requires minimal technical capabilities, which makes it appealing to companies that need a quick solution to monitor their tech stack, and who don't want to spend the time to implement their own monitoring solution.
Pros
- Easy to set up, requiring minimal technical background.
- More than 200 open-source integrations with popular cloud services, databases, web servers, and other tools help provide visibility across your entire tech stack.
- Attractive dashboards, which are highly customizable.
- Users can query custom metrics, events, and alerts through a full-featured API.
- Automated alerts are configurable, and can be sent through various communication tools, including Slack and PagerDuty.
Cons
- No mobile app, although you can text alerts to your phone.
- Only available on the cloud, which makes the product inappropriate for companies that require an on-premise solution (for example, due to compliance requirements).
- Application performance monitoring tool is still very new and in development.
- Does not offer synthetic monitoring or real user monitoring, though it integrates with several systems that do.
Datadog Pricing & Cost
Here's an overview of Datadog's pricing:
- Free for up to 5 hosts (with 1-day data retention).
- $15-$23/host per month (billed annually).
- APM costs an additional $31/month for users with less than 100 hosts.
- 14-day free trial.
Table of Contents
Full Review
Founded in 2010, Datadog is a VC-funded startup that offers a popular SaaS infrastructure monitoring solution used by thousands of companies. Datadog helps provide visibility across your entire devops stack by collecting various metrics, and by presenting them in convenient dashboards and reports. Because the software is cloud-based, Datadog users don't need to worry about storing their data. In fact, Datadog stores data for customers for up to 15 months, so that you can analyze historical trends.
In early 2017, the company began offering an APM product, which is fully integrated with Datadog's infrastructure monitoring system. However, since the APM part of the product is still relatively new, we will focus our review on Datadog's core infrastructure monitoring product.
Key Features
Below, we'll discuss some of Datadog's key features, and walk through the Datadog setup process.
Easy installation and setup
One of Datadog's major selling points is that it's quick to set up Datadog, as opposed to implementing your own solution.
To get started with Datadog, you will have to install the open source Datadog Agent, which is responsible for collecting metrics, on a host. You'll first need to create a Datadog account, and then you'll be provided instructions to install the agent for different platforms. In the screenshot below, you'll see the instructions for installing the Datadog Agent on Windows, which requires you to download the installer, and execute a simple command.

Once you've installed the agent, it will automatically begin collecting metrics and sending them over to Datadog's cloud-based servers. Though Datadog has extensive security security measures in place, companies with highly stringent security requirements (such as financial institutions) may still prefer to use an on-premise monitoring solution, which Datadog does not provide.
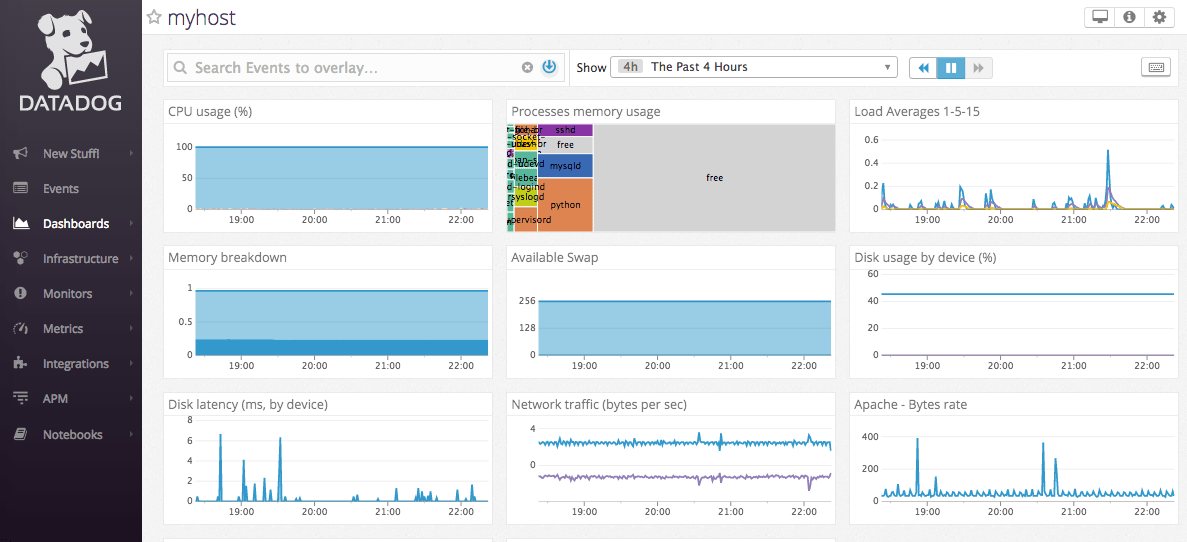
Within minutes of installing the agent, you'll begin to see your system metrics like CPU, network traffic, memory, load, and disk utilization populating a dashboard.
All in all, it takes about five minutes to install the agent and to see your metrics begin to populate in a dashboard. Users that want to install the agent across more than one server can refer to the installation instructions.
Integrations
Datadog integrates with over 200 different technologies, which makes it convenient to monitor various tools that you may use. When you sign up for an account, you'll be asked to select tools you're currently using in your stack.

Datadog integrates with many types of popular technologies, ranging from cloud services like AWS, to databases like PostgreSQL and MongoDB. Datadog also integrates with collaboration tools like Slack and PagerDuty, so you can easily share graphs with your teammates, and send automated alerts when the systen detects any unusual activity.
Activating an integration in Datadog usually involves making a few changes to a YAML template configuration file, and restarting the agent. Though you will have to invest some time in setting up all the integrations you need, that time can more than pay off in the long run, as doing so will provide visibility into the performance of your entire tech stack.
We like that Datadog's integrations are open source -- you can see the codebase here. This means that users can make contributions that will be useful to other Datadog users, and will also ensure that the integrations will stay up to date. In addition, if there's a technology that you use which Datadog doesn't currently integrate with, you can ask Datadog to create the integration, or you can create it yourself, and share it with the community.
Customizable dashboards
You've already seen the basic host-level dashboard that displays basic system-level metrics like disk, memory, and CPU usage. Once you install integrations for the different technologies in your stack, you'll start seeing more integration-level dashboards that show key metrics from that particular tool.
The nice thing about dashboards in Datadog is that you have many different visualization and customization options. Datadog has the concept of 'tags', which are customizable labels that you can assign to data. This makes it easy to aggregate and filter data by custom tags.
In addition to tags, there are many other ways to customize your dashboards. For example, you can use a single line graph to display multiple metrics, distinguished by three line styles: dashed, dotted, and solid. You can also visualize their trajectory in a trend line.

We especially like that team members can clone and create their own dashboards to suit their personal preferences and job responsibilities, and monitor only the metrics that they care about.
Automated alerts
Datadog offers eight types of monitors, including threshold-based alerts and HTTP checks. You can set up alerts based on specific thresholds, changes in metrics, or enable anomaly detection, which uses algorithms to detect when metrics are deviating from normal patterns (based on historical data). You can also write your own custom checks to get notified, for example, when an application is not responding.
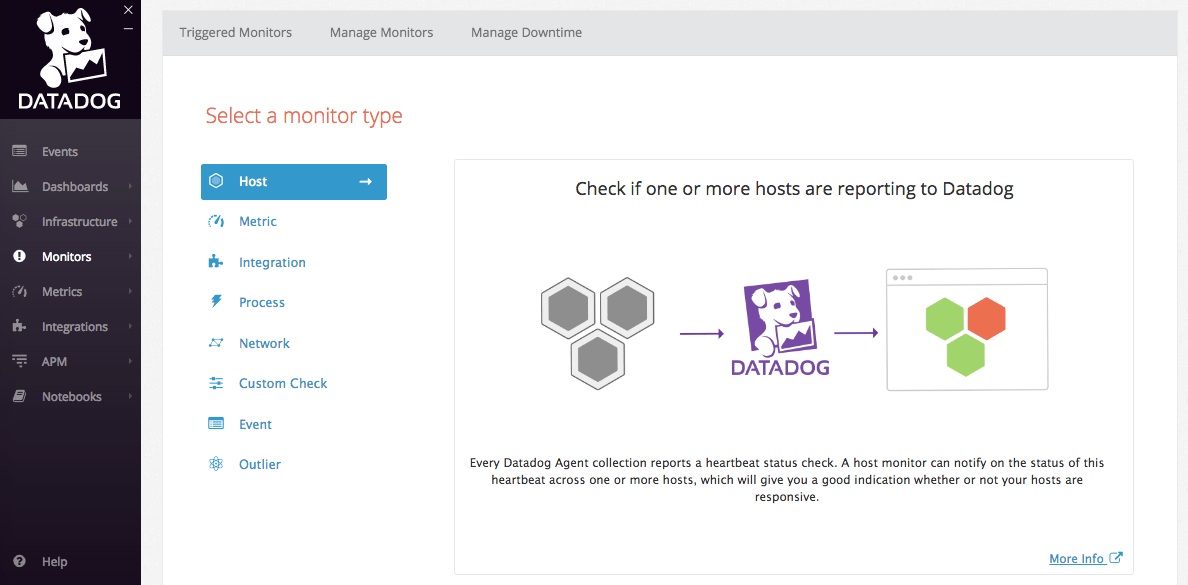
You can set up alerts based on any metric or combination of metrics across whatever tags you've set up across hosts, and set up a simple alert (to alert on the aggregate value), or a multi alert (to trigger a notification for each separate host that experiences an issue).

If you know that certain systems will be undergoing maintenance at a specific time, you can schedule downtime to avoid receiving false positives during this time.
Alert conditions are also highly configurable so that you can be sure that you are contacting the right person/team in every scenario. Datadog supports the designation of separate alert and warning thresholds. In addition, by further customizing your message with template variables, you can notify different people based on your predefined conditions. Datadog integrates with collaboration/communication tools like Slack and PagerDuty, but you can also notify users through more traditional methods like email and SMS/text message.

Is Datadog the right software for you?
Datadog is an infrastructure monitoring service that recently expanded into application performance monitoring capabilities. If you want highly customizable dashboards, and highly configurable alerting, Datadog is an excellent choice that makes it easy to quickly get up and running. By leveraging Datadog's 200+ integrations, you can get full visibility across all of the tools and services in your stack.
Since Datadog only has cloud-based offerings, if you require an on-premise solution, you'll have to look elsewhere. However if you are interested in a cloud-based monitoring solution, then Datadog is a top option to consider, and worth signing up for a 14-day trial. Since the agent is easy to install, you can get up and monitoring your systems within a matter of minutes, so that you can see if Datadog is right for you.